You don’t need to trade on charts to read them. A candlestick chart is just a compact record of what price did over a period of time, and being able to parse one keeps you from making portfolio decisions based on a headline or a screenshot someone posted at 2 a.m. Here’s the whole vocabulary in one sitting.
What one candle records

Every candle packs four prices into one shape. The thick part, called the body, runs from the opening price to the closing price of the period. The thin lines above and below, called wicks or shadows, mark the highest and lowest prices that traded during that same period.
Color tells you the direction. A green (or hollow) candle closed higher than it opened. A red (or filled) candle closed lower. On a daily chart, one candle is one trading day. On an hourly chart, one candle is one hour. That’s it. Everything else in the chart is these candles lined up in a row.
The wick is the part people skip

A long wick shows a price that didn’t hold. A candle with a long upper wick means buyers pushed price up during the period and sellers took it back before the close. On a chart of Bitcoin in a falling week, those upper wicks show up at every attempted bounce.
The famous shapes have names. A doji, where the body is a flat line because open and close sat at nearly the same price, marks a period where neither side won. A hammer, small body on top of a long lower wick, shows sellers pushing down and failing. The names are 18th-century Japanese rice traders’ terms, and the candlestick chart has barely changed since.
Timeframes change the story
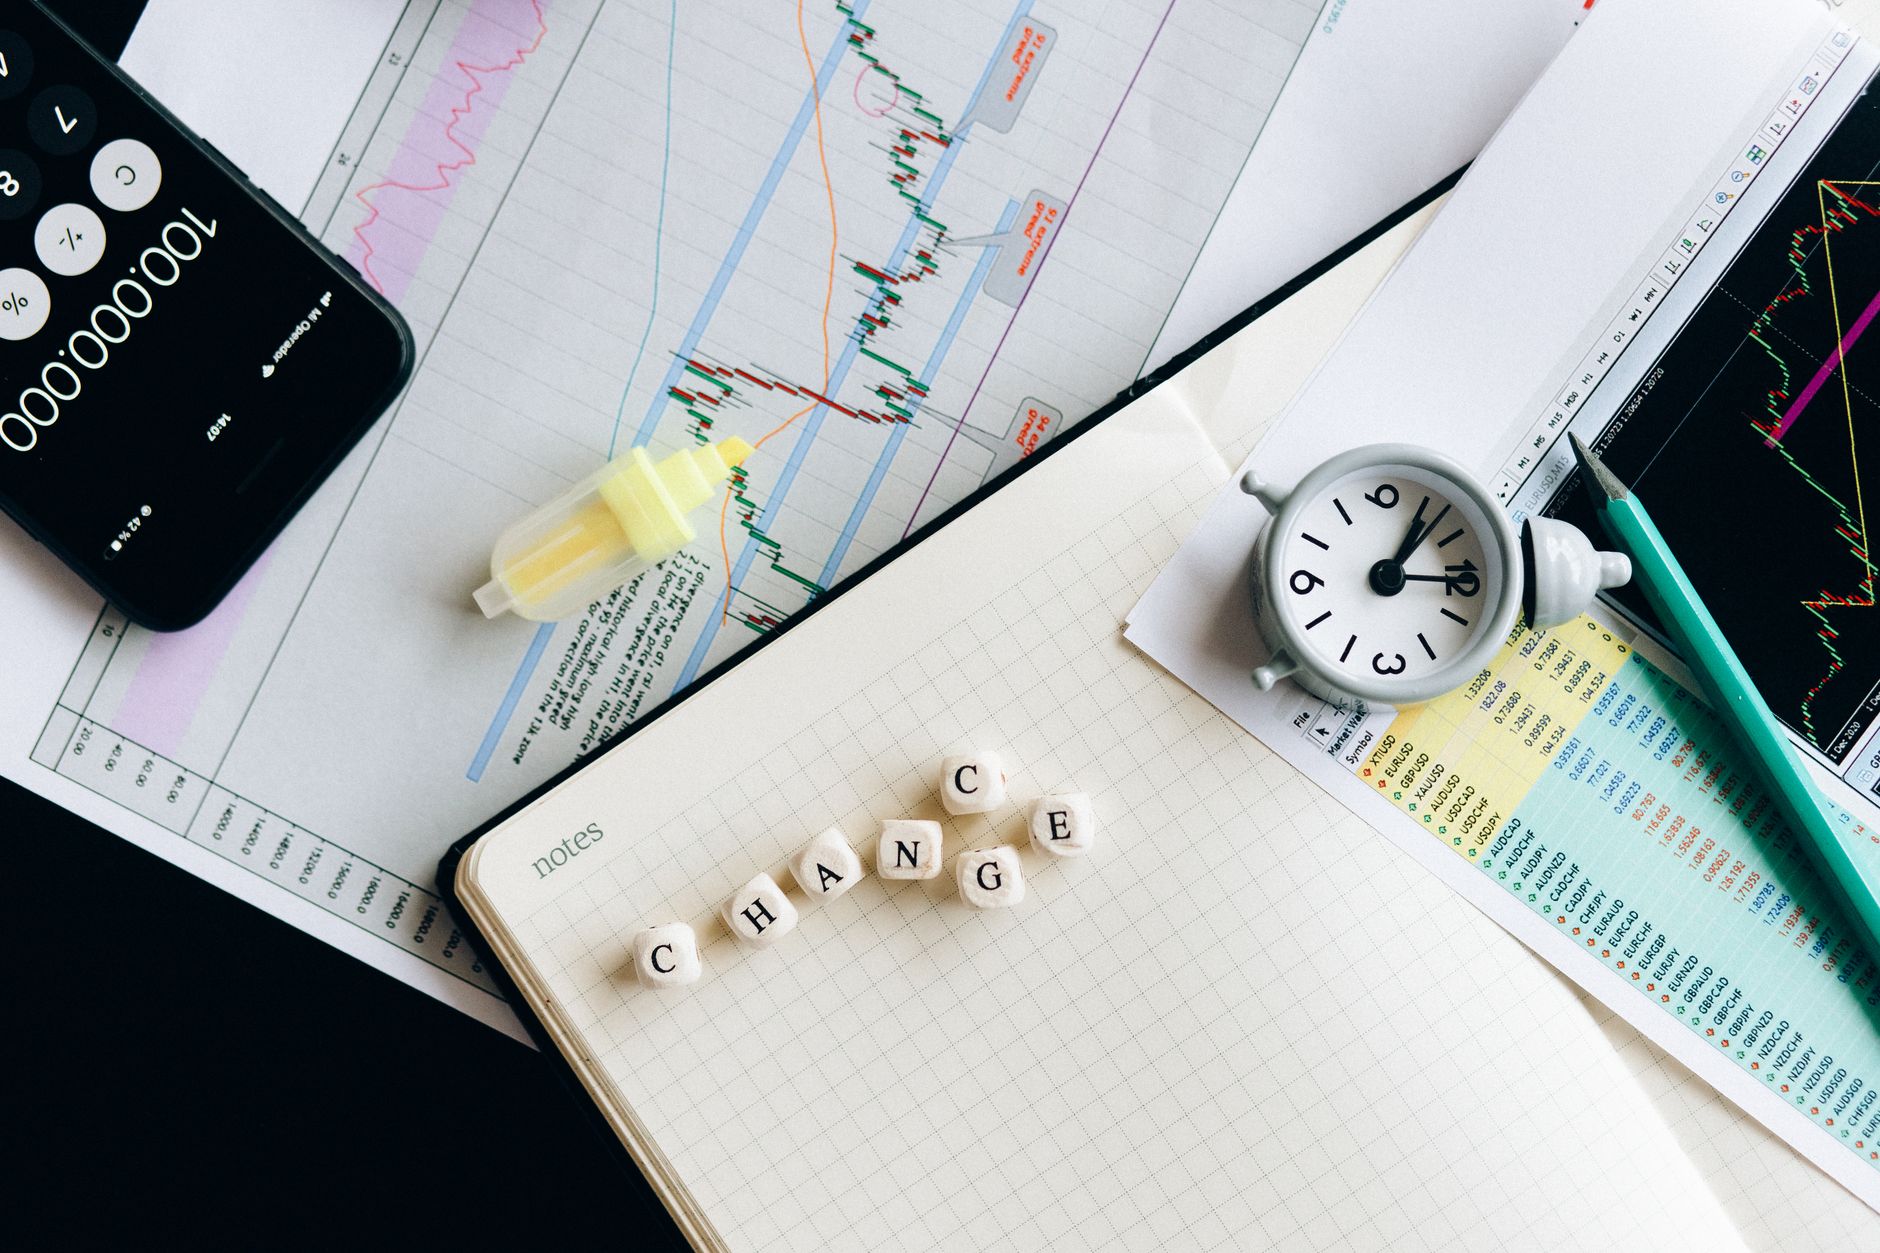
The same market looks calm on a weekly chart and chaotic on a 15-minute one. If you hold spot and rebalance quarterly, the 15-minute chart is noise that exists to make you feel things. The daily and weekly charts are where the actual trend lives.
A useful habit: check the weekly chart before the daily, and the daily before anything faster. If the weekly shows a steady climb with shallow pullbacks, a red afternoon means nothing. If the weekly shows lower highs for two months, a green morning means nothing either.
Volume sits underneath for a reason
Price movement without volume is a rumor. Volume bars along the bottom of the chart show how much actually traded in each period. A breakout on heavy volume has conviction behind it. The same price move on thin volume, common on weekends and in small altcoins, reverses just as easily.
Most charting tools, from TradingView down to the basic charts in Coinbase and CoinGecko, show volume by default. Turn it on if it isn’t.
What charts can’t tell you
Candles record price, and price is the effect. The cause might be an ETF flow number, an exchange outage, a regulatory headline, or one large holder selling. The chart shows the footprints and leaves the story to the news. Anyone who tells you a candle predicts the cause is selling something.
For a holder, the honest use of a chart is narrow and worth the 20 minutes it takes to learn: see the trend, spot the level where price has turned around before, and keep your hands off the app during the hours when the chart looks its worst. The people who still have portfolios in 2026 read the chart, then go outside.

